Chino's Prices Barely Moved. Its Buyer Pool Dropped by Two-Thirds.

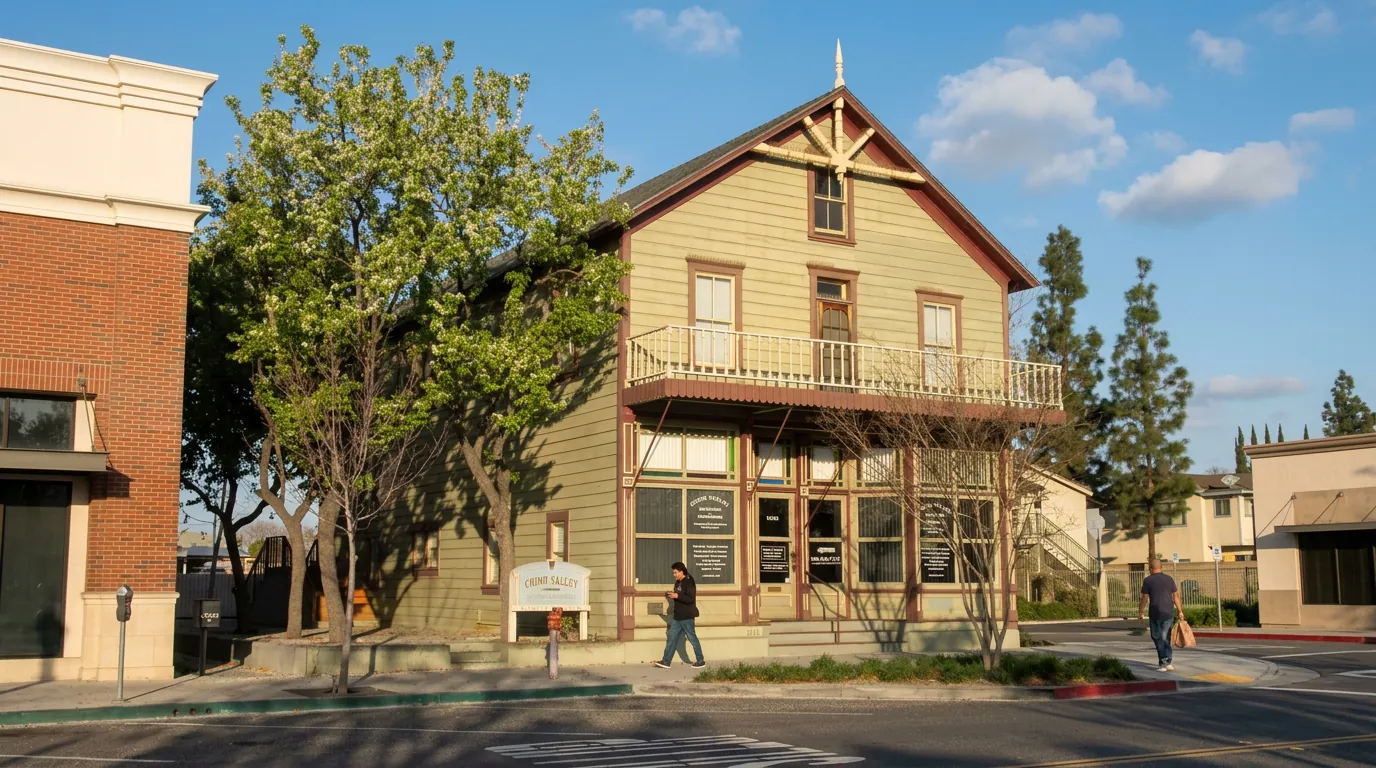
The median Chino home sold for $730,000 in August, down all of 0.7% from a year ago. Basically flat. If that were the only number you saw, you’d think nothing changed. Then you look at pending sales: down 68.3% to 20. That’s the sharpest collapse in buyer activity of any market we track this month, and it happened while prices held. That gap is the entire Chino story.
Prices held, but the mix is shifting
The median was essentially flat at $730,000, while the average price rose 5.7% to $806,073: a sign that more of the higher-end homes closed this month, pulling the average up while the typical home held steady. Price per square foot was $399 (down 3.2%). Homes still closed at 100.0% of last list price, though at 98.2% of the original asking price, which tells you the typical sale involved a price adjustment before it found its buyer.
Supply got scarce fast
Inventory in Chino didn’t build. It dried up. New listings fell 28.8% to 57, active listings fell 32.9% to 159, and months of supply dropped 32.6% to 2.9. Under three months is a seller’s market by the standard measure, and that’s what’s keeping sellers in control here even as demand thins. Fewer homes for sale is the only reason this isn’t tilting to buyers.
Demand fell, but not evenly
Pending sales cratered 68.3%, yet closed sales held up far better at 49 (down 14.0%), with total closed sides of 106.0 and closed volume of $85,443,756, essentially flat at down 1.7%. That split (pendings way down, closings only modestly down) means the pipeline is thinning even though August’s completed deals looked fine. Pendings lead, so it’s the number to respect.
Homes take a little longer here
The median Chino home went under contract in 27 days: the longest of any city on this list, though still 10.0% faster than a year ago. One data note worth flagging: showings to contract were reported at 6.0, a 100% jump, and 3.1 showings per listing. In a market this size, showing counts swing on small numbers, so treat that jump as noise rather than a real surge in traffic.
The full August scorecard
On the supply side, Chino brought 57 (down 28.8%) new listings, held 159 (down 32.9%) active listings, and carried 2.9 (down 32.6%) months of supply.
On demand, pending sales came in at 20 (down 68.3%), closed sales at 49 (down 14.0%), total closed sides at 106.0 (down 7.0%), and total closed dollar volume at $85,443,756 (down 1.7%).
On price, the median came in at $730,000 (down 0.7%), the average at $806,073 (up 5.7%), and price per square foot at $399 (down 3.2%). Homes closed at 100.0% (up 0.1%) of last list price and 98.2% (down 0.1%) of original list price.
On timing and activity, the median home was 27 (down 10.0%) days active in the MLS, with 6.0 (up 100.0%) showings to contract and 3.1 (down 3.1%) showings per listing.
If you’re selling
Scarce inventory is your advantage: 2.9 months of supply and full-price closings at 100.0% of last list keep you in control. But pendings down 68.3% is a warning you can’t ignore: the buyer pool is thin, so price to the comps and be ready for the home to take around 27 days. This is a seller’s market on supply, not on demand, and that distinction should shape your pricing.
If you’re buying
Choices are limited at 2.9 months of supply, so you won’t have a huge menu. The upside is the one most buyers miss: with pendings down two-thirds, you have far less head-to-head competition than the low inventory suggests. Fewer rival offers, a bit more time (27 days), and homes closing at list rather than over. Move decisively on the right one, but you’re not walking into a bidding war.
The bottom line
Chino is the month’s clearest example of why one number lies. Flat prices ($730,000, down 0.7%) and a 68.3% drop in pending sales, held together by scarce supply at 2.9 months. It reads as a seller’s market because there’s so little for sale, but the demand behind it is fading, and that tension is where the real negotiating happens. Your specific price range tells you far more than the citywide median, and that’s the conversation to have first.
Frequently asked questions
What is the median home price in Chino?
The median sale price for August 2026 closings was $730,000, down 0.7% year over year.
How long are homes taking to sell in Chino?
The median home spent 27 days active in the MLS before going under contract, down 10.0% from a year ago.
Are homes in Chino selling for asking price?
On average, closed homes sold at 100.0% of last list price and 98.2% of original list price. The closer that number is to 100%, the less room there was to negotiate below asking.
The Verdict: Chino Is a Seller’s Market
Chino is a seller’s market. At 2.9 months of supply (under the three-month line that divides the two), sellers hold the edge, and homes are closing at 100.0% of last list price to prove it. The one check on that power is demand: pending sales came in at 20 (down 68.3%), so a thin buyer pool means the price still has to be right. But the leverage this month sits with sellers.
Data source: RECore MLS / InfoSparks. All figures reflect closed residential transactions for August 2026; percentages are year-over-year changes versus August 2025.
Irene Haislip
Connects the cause to the effect, every month
Irene covers Chino and the surrounding Inland Empire. Her updates take the month's headline number and trace it back to what moved it, so buyers and sellers know which way the pressure is pointing before they price anything.
